
Data Analysis
Beginner to Intermediate 8-9 weeks
Full Stack Data Analysis
Master Advanced Excel, SQL and Power BI to clean, analyse, transform and communicate real-world business data.
View courseAnalyze operational workflows, service levels, capacity, and process performance to identify measurable improvement opportunities.
Register for This CourseLevel
Beginner
Duration
6 weeks
Delivery
Physical & Live Online
Category
Data Analysis
Learn operations analysis through process metrics, capacity analysis, service-level reporting, and practical improvement projects.
An applied analytics course for improving operational performance. Learners map processes, define throughput and service metrics, analyze bottlenecks and variation, and build reports that support practical improvement decisions.
Who it's for: Operations staff, process analysts, service managers, and data analysts working with operational performance data.
Master Advanced Excel, SQL and Power BI to clean, analyse, transform and communicate real-world business data.
View course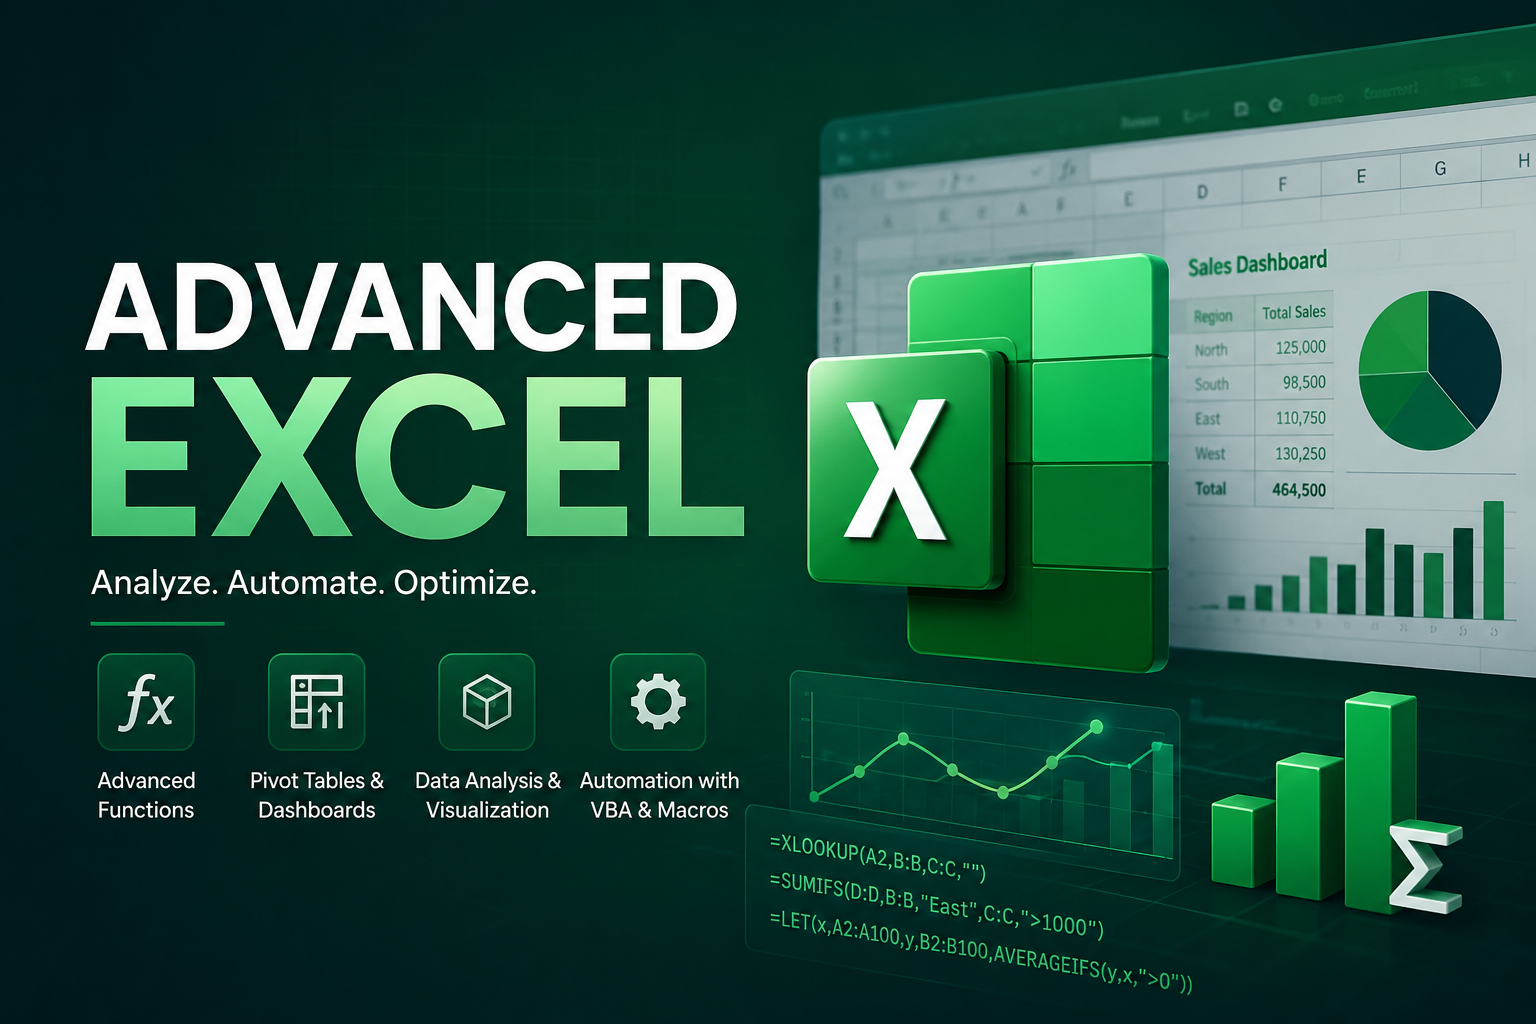
Master advanced Excel techniques for data cleaning, analysis, dashboard development, reporting and business decision-making.
View courseTransform raw business data into interactive dashboards, meaningful KPIs and actionable insights with Power BI.
View course